crowded airport GettyImages 670570760 scaled
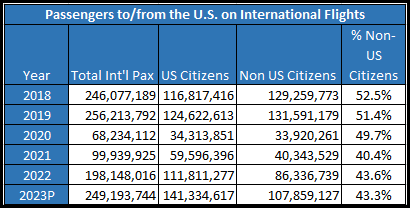
Looking only at the US market, we can see that the travel recovery trend is not even between US and non-US citizens. The data we use here comes from the US NTTO and is based on the I-92.

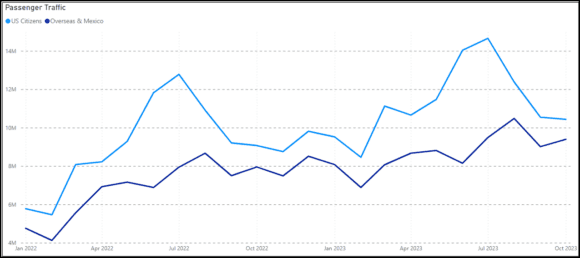
The last column shows how the traffic profile is changing – non-US citizen share of traffic has declined by over 17%. The following chart shows the trends over the period January 2022 through October 2023—US citizen traffic spikes in the summer, with considerably more traffic leaving the US than entering.

The chart shows that US outbound traffic skied while inbound non-citizen traffic grew slower. Since nothing is evident from this data level, we dug deeper.
If we look at the same chart for the US/Asia market, we see this chart. Note the traffic flows are more steady with no spikes. Moreover, the inbound traffic to the US is the majority.

Looking at US/EU traffic, we see what is likely the driver behind the spike we saw in the first chart. We see the summer US spikes to Europe. But note the sharp increase in 2023 over 2022.

Looking at US/North American traffic (Canada & Mexico), we see a pattern similar to that of Europe. It looks almost like those Americans who did not go to Europe in 2023 went to Canada or Mexico.

Finally, the data also offers a guide to airline selection. Notice in both charts that US flag airlines have a commanding advantage. Among US citizens, US airlines typically capture 60% of the traffic. Over time, though, that share is declining. Over the period, we see US airlines with a 13% lower share.
About 40% of non-US citizens fly on US airlines; their share has declined by 16%.

US airlines have a “home court” advantage, which appears to be declining. The reviewed period does not offer enough history to make any definitive statements. But the apparent evolving trend is worth noting.
Views: 0


