2020 01 14 9 09 19
It is a common thread that airlines pad their schedules. The idea is that they do not want to show up late because that does not look good. The logic behind the padding idea is clear. But how big of a “thing” is this? Is there a gregarious amount of fibbing involved? Or could it be more of a little bending of the truth?
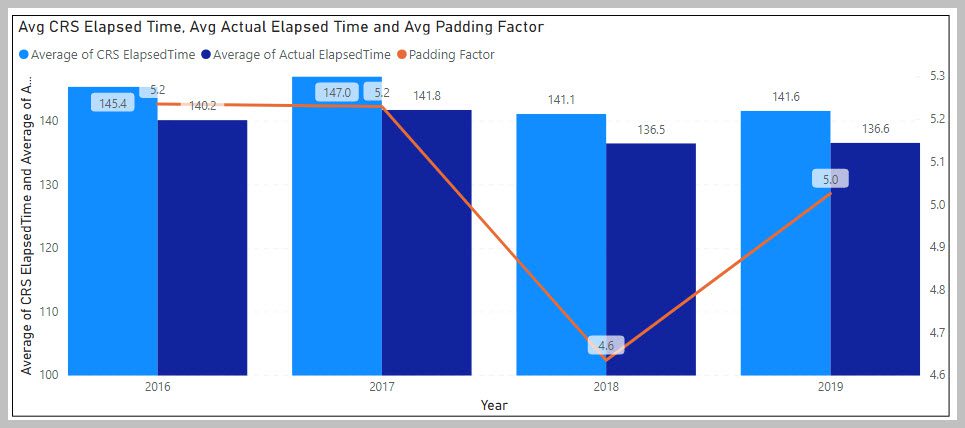
Looking at the US DoT On-Time data from 2016 through October 2019 we see the following. The chart shows the industry numbers for CRS elapsed time, or what the airlines say they need to complete a flight, in light blue. The dark blue shows the actual elapsed time taken to complete a flight. All numbers are averaged. The orange line shows the difference between the two – or padding amount.
- Over the period, padding looks like a little truth-bending rather than an outright lie
- The typical padding is around five minutes – roughly 4% of actual elapsed time
- Given the myriad exogenous factors that could impact a schedule, five minutes is rather good
- Moreover, over the period, the padding factor is decreasing which suggests airlines are getting better
However, individual airlines and specific routes see much wider variances. As an example here is what the top five destinations out of Boston look like for JetBlue. As you can see, times don’t always improve.
Padding is, therefore, something one needs to evaluate on a case by case basis. Subscribers can experiment with airlines and routes on our model.
Views: 2


