5 16 2022 9 24 58 AM
“Green” is the new thing in aviation – sustainable aviation is the new mantra. The airline industry wants to be carbon neutral by 2030 or 2050, depending on China. The goal to move toward a cleaner environment is admirable and appropriate. Clean air is like clean water, we can never get enough of it.
The challenge is, though, what are the tradeoffs? After all, once you experience air travel, you’re never going back. Everyone remembers their first transocean, international flight. It is a magical thing to be hurled through the sky at over 500 MPH, for over half a day, and end up halfway around the world. Safely, and in air-conditioned (sort of) comfort.
Recently we started building carbon models to see how much the green issue impacts US air travel. These models set us on a path of discovery. With each model, we learned more and the most recent lesson was that focusing on seat/miles, while useful, ignored valuable revenue belly cargo space. This was an important nuance and back to the models, we went.
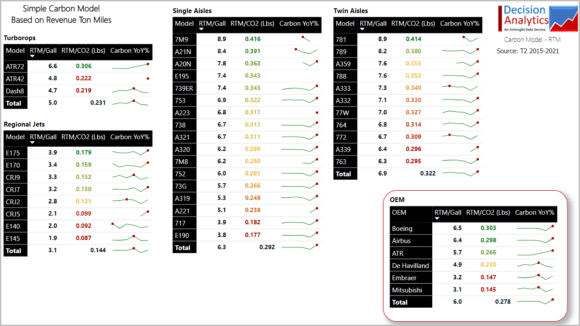
Using the US DoT T2 source, we revised our model to take into account revenue ton-miles and use that as a metric rather than seat miles. The change was quite dramatic. So dramatic that we spent hours checking and re-checking. Here’s what we found.
If the image is small on your monitor, please click it to get a larger view. Each of the tables is an aircraft segment. The table in the red box at the bottom right is the summary by OEM. Each table offers two data points; revenue ton-miles/gallon of fuel and revenue ton-miles/pound of carbon generated. The goal is to generate the highest revenue ton-miles per gallon of fuel.
The US Energy Information Agency offers this guide to carbon generated per gallon of fossil fuel. The key number is 12.5 pounds of carbon per gallon of Jet-A burned. The numbers in color show the greenest aircraft on top. The green sparklines show the trend of each aircraft since 2010, with the red dot showing the high over the period.
The results:
- Overall, Boeing has the best score – its aircraft deliver the highest revenue ton-miles per gallon of fuel burned. (Focusing on passenger aircraft)
- It is quite amazing to see the MAX9 and 787-10 have nearly the same score.
- In the OEM chart notice how ATR has improved its score. This is impressive since turboprop engine technology has not improved as fast as turbofan technology. Engine OEMs keep trying to squeeze more power from each gallon of gas.
- The turboprop arena is the place to look for new technologies as we note in this related story.
- Notice sparklines are generally rising. Aircraft operators are steadily improving fuel burn and thereby reducing carbon emissions per payload. And that is before SAF is widely used.
In summary, US airlines are improving their carbon footprint. Even though the data presented is based on US airlines, the sheer volume of data provides a useful global benchmark that likely applies everywhere.
Views: 1


