2020 12 11 12 51 01
Using data from our Chinese partners, VariFlight, we can share updates on the Chinese air travel market. We have three charts to share with you.
In the first chart, you see how the pandemic was a shock to China’s airlines – as it was globally. China’s airlines got hit first and have been the first to recover.
When we compare the China and US markets, we note an important change. Going into the crisis, the US market was a lot larger than China’s. With the air travel recovery in China starting two months earlier, and a lack of air travel demand in the US, the Chinese air travel market is no longer smaller than that of the US. Will the pandemic be the event that changes this situation permanently? Or will US air travelers come back to return the US air travel to its former robustness?
Next, we look at the Chinese majors. We can see China’s majors built back their schedules quickly. We have heard that the government encouraged this, so it may not have been entirely an economic decision driven by air travel demand. That said, clearly, China’s majors went through a V recovery compared to the US airline “swoosh”.
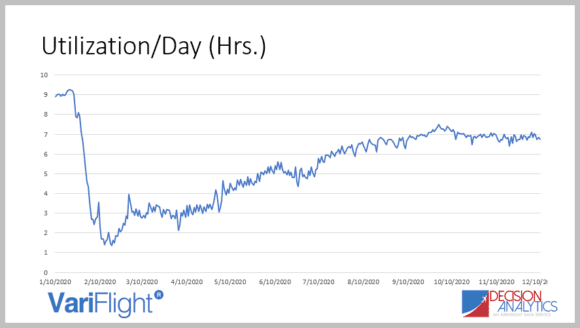
In terms of fleet activities, we see a robust turn in late February. There were a few false starts, which is understandable. The confusion at the time must have been vexing. But notice how reality has set in. Whereas January saw over 9 hours per day in December we are seeing under 7 hours. And this would be with many aircraft still parked. The state can force airlines to rebuild schedules but the reality of the business is that utilization gives us another perspective.
In summary, China has seen a strong recovery among its airlines in terms of flights. We don’t know about actual traffic numbers yet. If traffic has moved in symmetry with flights, China’s air travel market may now have grown to be equal to that of the US.
Views: 2


The completion rates don’t mean anything other than instances of unexpected disruptions. If a company gets subsidy or order from the state to complete all flights, you will not know whether they fly 10% of the original December 2019 schedule with 90+% completion factor or the full Dec 2019 schedule with 90+% completion. Also the second graph trends don’t match with the first graph for most part, but the contradiction is most evident for Dec 2020.